
Neighbirdhood
2026
Use Claude Code to visually display my neighborhood bird sightings across various time periods
Imagining a better way to see bird data
While no app beats eBird for its community data, the visual representation of that data left me wanting a little more.
I started birding in early 2026 with most of my sightings taking place in my backyard, or walking my dog in my neighborhood.
While it is fun to travel to nearby parks and bird, I was really interested in seeing my local neighborhood visitors over time, where I could easily track enough sightings to see trends over time.
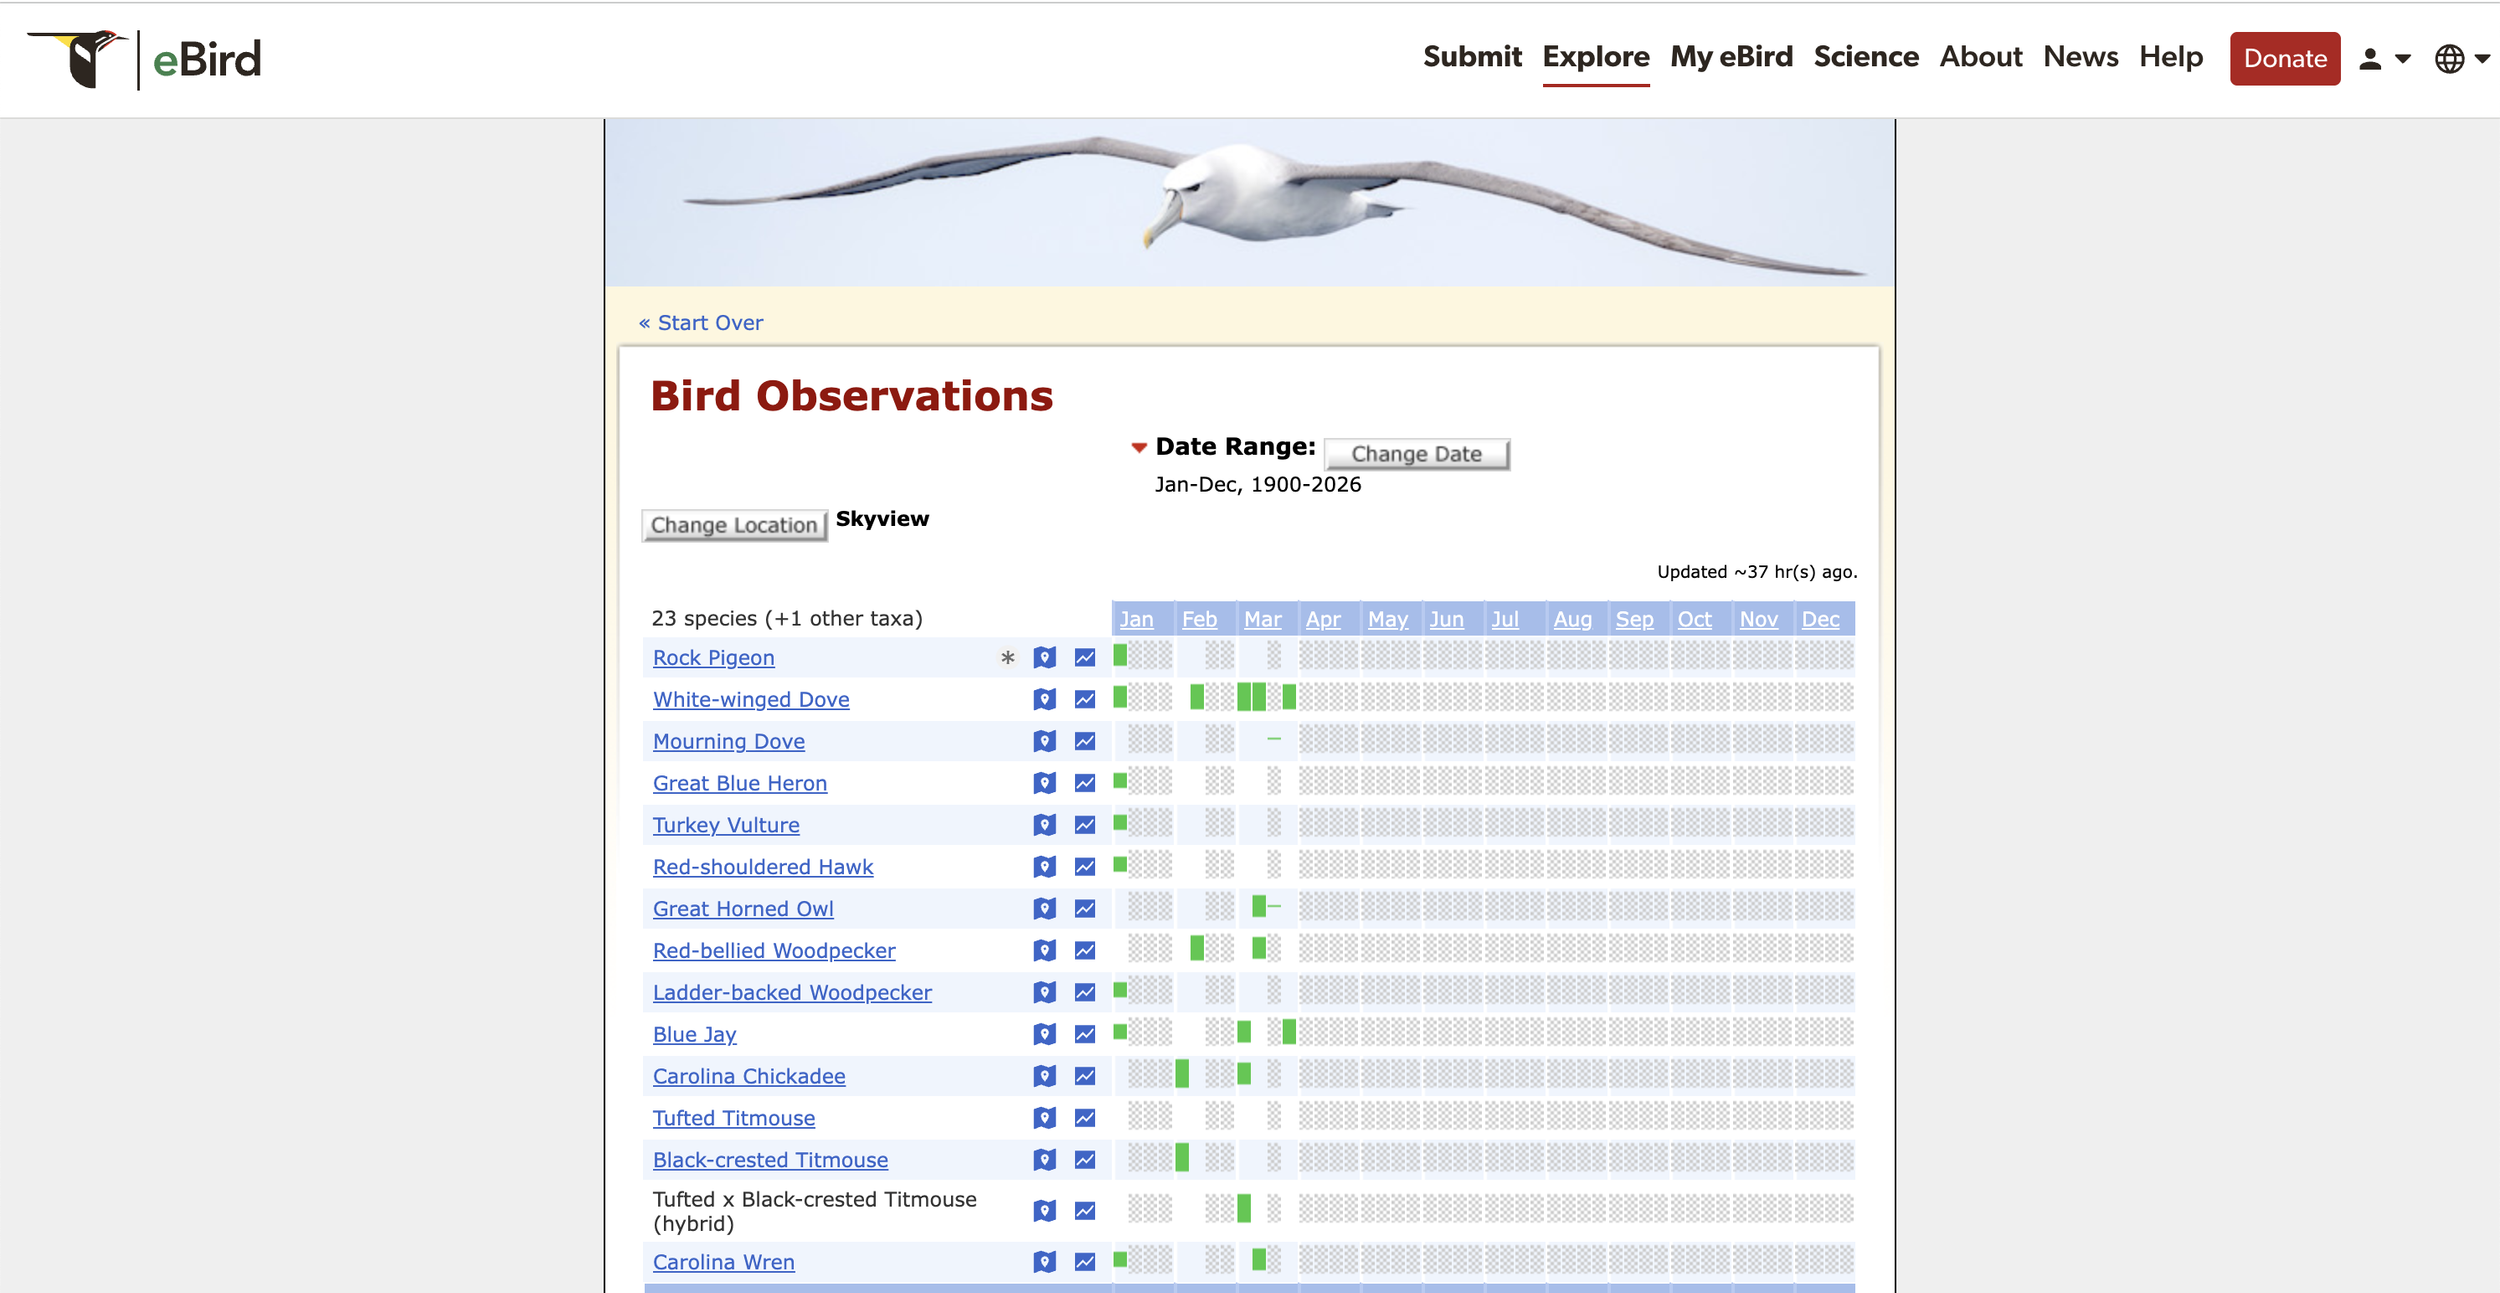
Existing eBird visualization by monthSketches and initial prototype
I started sketching out what I wanted to show:
Number of unique species per day, month, season, and year
Different views for each time period
Fun, whimsical data visualizations that matched the spirit of birding
After some fine adjustments, the prototype was looking pretty close. The more I played with it, the more functionality I could imagine.
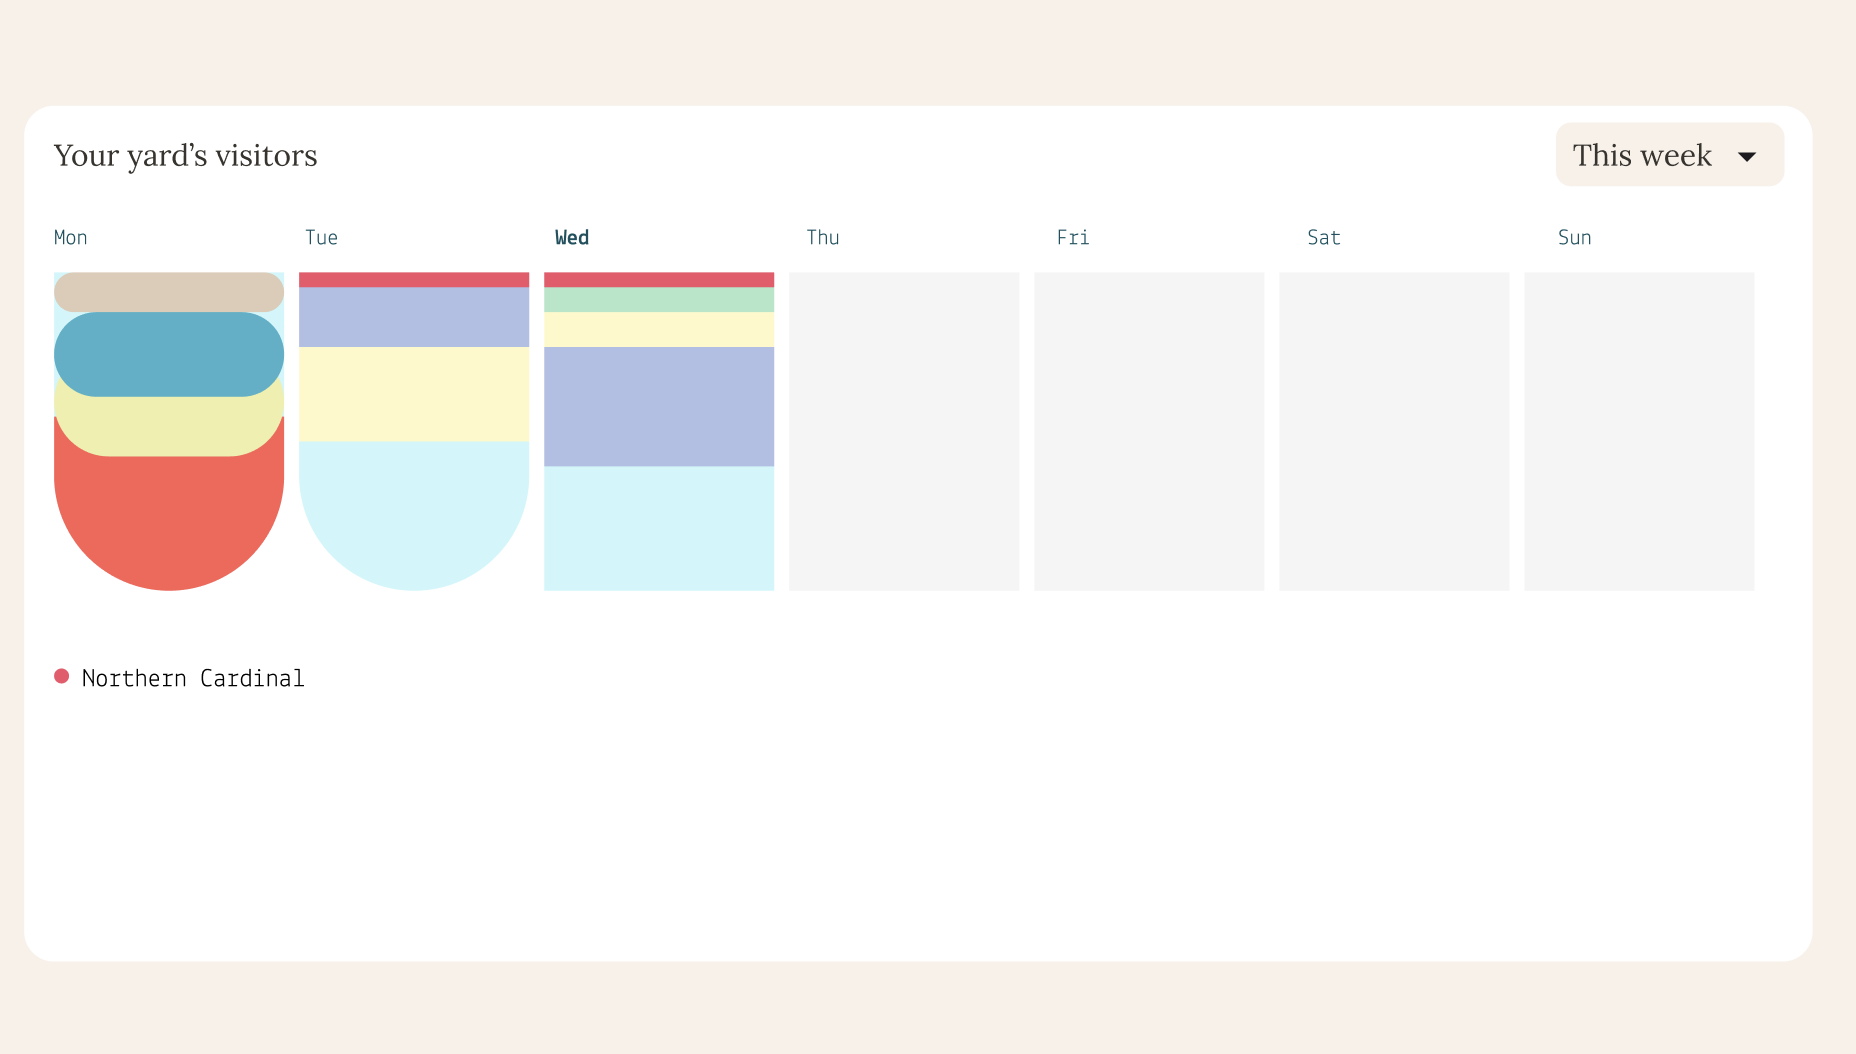
I played around with some ideas in Figma before jumping into Claude Code; having a better idea of what I wanted helped me be clearer in my prompts
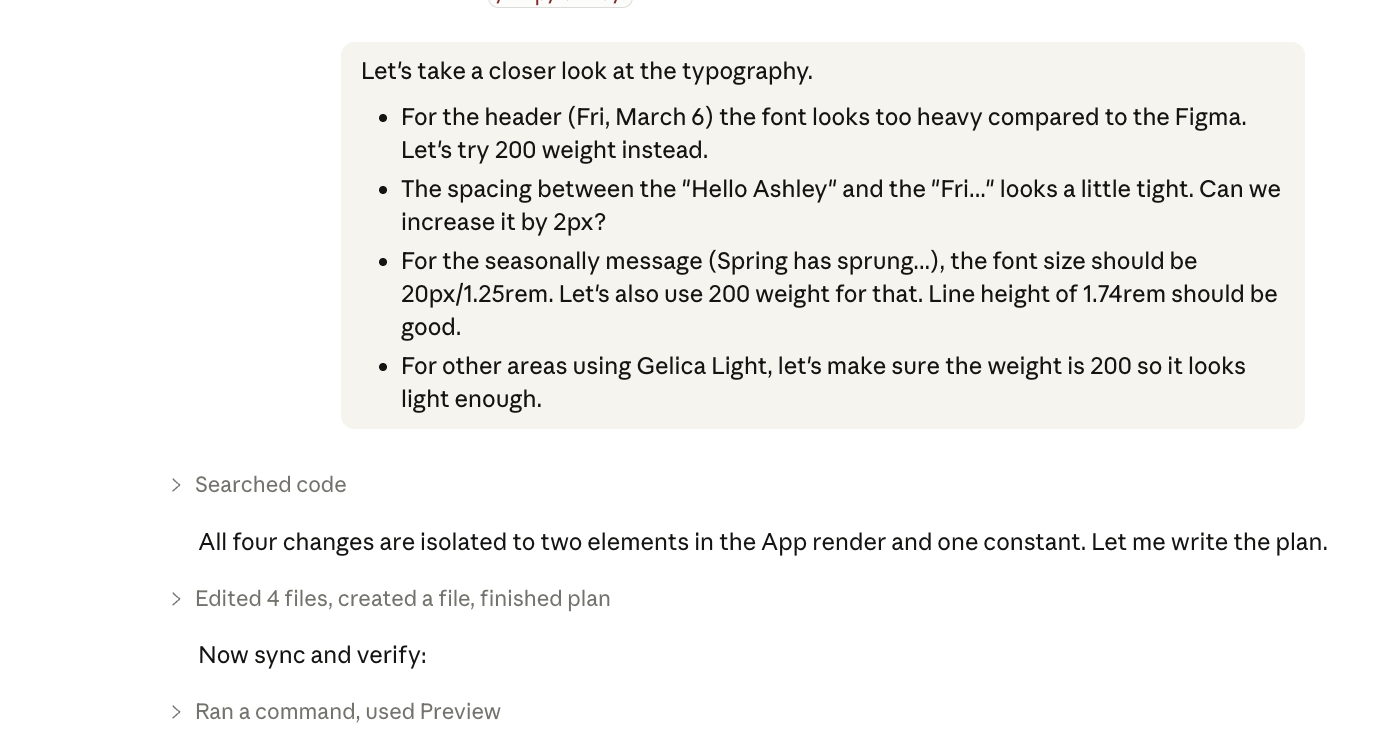
The most tedious part was adjusting typography and spacing, which Claude didn’t get right without very specific instructions.
After a bit of back and forth, we were looking closer to my vision.
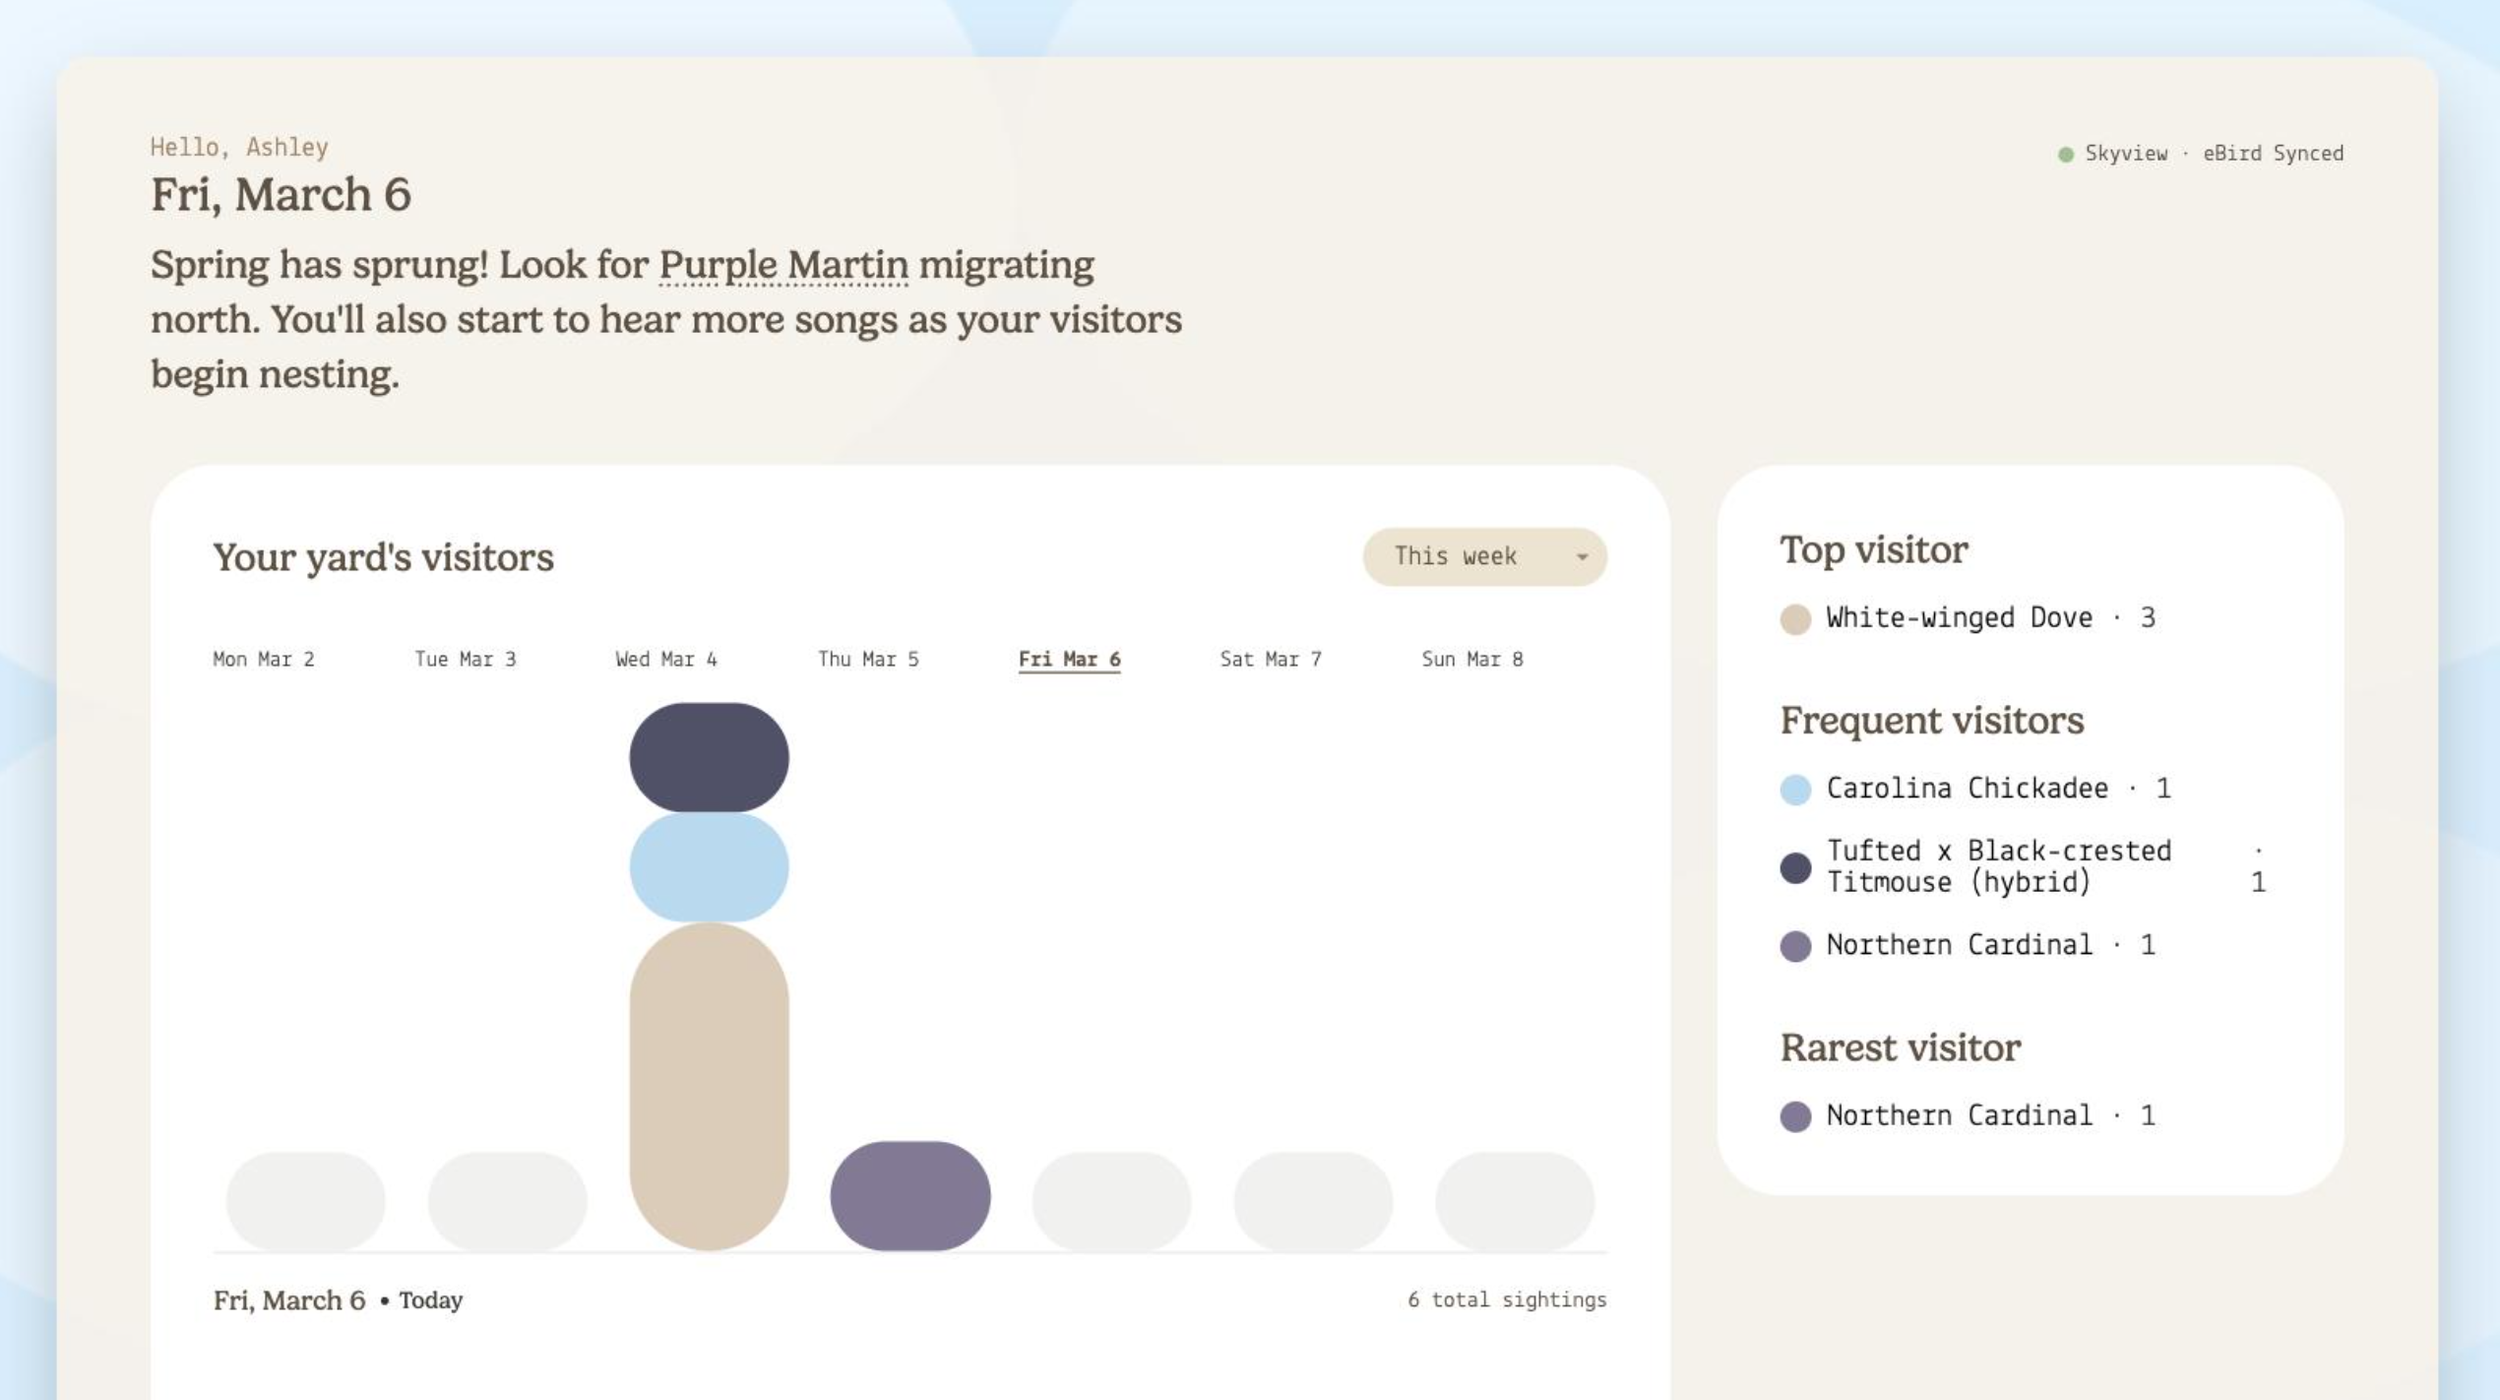
Neighbirdhood
The finished (for now!) prototype includes:
Live weather and synced eBird data for my custom neighborhood location
Leaderboard with top, frequent, and rare visitors
Charts for weekly, monthly, seasonally, and yearly visitors
Species-specific color coding
Whimsical grass and cloud animations
Final considerations
Overall, I was very pleased with how this project turned out. I learned a lot about best practices working with Claude Code for rapid prototyping ideas. Being able to experiment with real code definitely inspired directional changes in the concept that I don’t think I would’ve discovered as quickly with static designs.